
Unlike classic ASP, ASP.NET provides easy-to-use tracing functionality that can be used to monitor the application. ASP.NET tracing tasks can be subdivided into three main categories:
With ASP.NET, generating page-level tracing is very easy - just set the Trace attribute of the @Page directive to true:
<%@ Page language="c#" Codebehind="default.aspx.cs" trace=true ... %>
By simply setting Trace = true you get the following trace information in the trace output:
With page tracing you can include your own tracing information, and when tracing is turned on, this information will appear in the Trace Information section. The following page illustrates the above information:
You can add more trace information to the Trace Information section by using the Write and Warn methods of class Trace in the code behind module. Note that the default sort of trace messages is by time, but you can change the sort order to sort by category using the TraceMode attribute:
<%@ Page language="c#" trace="true" TraceMode="SortByCategory" %>
What if you wanted all your ASP.NET pages to generate trace statements. It would be quite a headache to add the Trace="True" attribute to each page's @Page directive, especially if you have 10s or 100s of pages. And what if you later wanted to disable tracing? A much better way to control application-wide tracing is to use the Web.config file. The tracing features that you can add in the Web.config file are actually richer than those in the @Page directive. The following shows a sample Web.config file that enables certain tracing features:
<configuration>
<system.web>
<trace enabled="true"
requestLimit="10" pageOutput="true" traceMode="SortByTime"
/>
<\system.web>
<\configuration>
enabled attribute enables or disables tracing for the entire application. If set to false, page tracing via the Trace attribute is still possible. pageOutput attribute enables/disables tracing details for each page within an application. However, if this item is set to false while the enabled attribute to set to true, the traces will be kept in memory
Once application-level tracing is turned on, you can view the entire application's trace information in one central location: trace.axd. For example. to view the trace information for any given ASP.NET Web application:
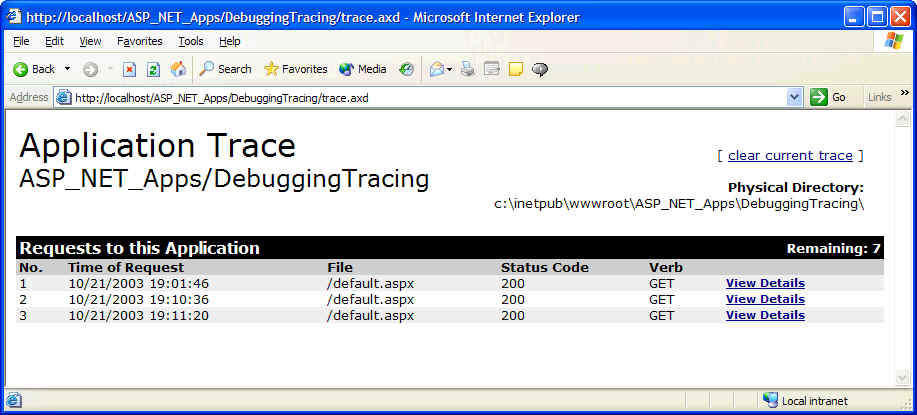
Note that trace.axd was invoked from within the application's directory, and not from some other central location. The ViewDetails link is used to display the trace information for the associated request. trace.axd offers a number of advantages:
Debugging ASP.NET projects is very easy. However, you need to be aware of some important points. In the ASP.NET application's Web.config file there exists a <compilation> element with the following default values:
<compilation defaultLanguage="c#" debug="true" />
When an ASP.NET application is first created, the <compilation> element has its debug attribute set to true, and the project itself is configured to Debug (rather than release). The interaction of these two items described which parts of an ASP.NET application can be debugged as follows:
| Settings | Meaning |
| <compliation debug="true" .. > and Debug Build | Can debug HTML and code behind modules. |
| <compliation debug="true" .. > and Release Build | Can debug HTML but not code behind modules. |
| <compliation debug="false" .. > and Debug Build | Cannot debug (see dialog box below.) |
| <compliation debug=" false" .. > and Release Build | Cannot debug (see dialog box below.) |
In the last two cases where debug is true and irrespective of the solution build configuration, if you try to debug the application you will get the following dialog box:
