Tracing and Logging
Summary
Introduction
WCF provides several GUI and command line tools to make it easier for you to create, deploy, and manage WCF applications. For example:
- Use the Service Configuration Editor Tool (SvcConfigEditor.exe) to create and edit WCF configuration settings using a wizard, instead of editing XML directly.
- Use the Service Trace Viewer Tool (SvcTraceViewer.exe) to view, group, and filter trace messages so that you can diagnose, repair, and verify issues with WCF services.
WCF provides a rich set of functionalities to monitor the different stages of a WCF application’s life:
- Message logging allows you to see how messages look both before and after transmission.
- End-To-End tracing provides instrumentation data for troubleshooting an application without using a debugger. Tracing can be enabled for a running application to monitor its progress.
- Event tracing writes events in the Event Log for any major issues.
- Performance counters exposed through Performance Monitor enable you to monitor your application and system's health.
- You can use the Configuration Editor to edit the configuration settings using a GUI wizard.
The first two points, logging and tracing, are the most important and are covered in the sections that follow. The other remaining functionalities are covered in more detail in MSDN.
Message Logging
Message Logging refers to WCF’s ability to log incoming and outgoing messages. This kind of logging allows you to determine what arguments were passes and how the receiving endpoint saw the arguments expresses as XML. Also logging the message as it was received allows you to diagnose malformed messages as well as to see how the message arrived. You can also examine the security tokens used, parts encrypted and signed, and parts left intact.
Message Logging can be enabled via the SvcConfigEditor tool by selecting the Diagnostics node and then enabling options under Message Logging as shown below (note that this affects the underlying config file directly):
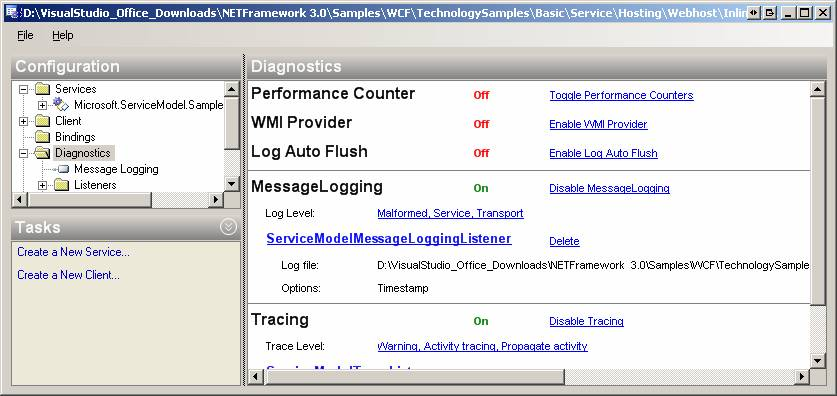
WCF logs messages at two different levels, service and transport: Messages logged at the Service Level are about to enter (on receiving) or leave (on sending) user code. Infrastructure messages (transactions, peer channel, and security) are also logged at this level, except for Reliable Messaging messages. Messages logged at the Transport Level are ready to be encoded or decoded for or after transportation on the wire.
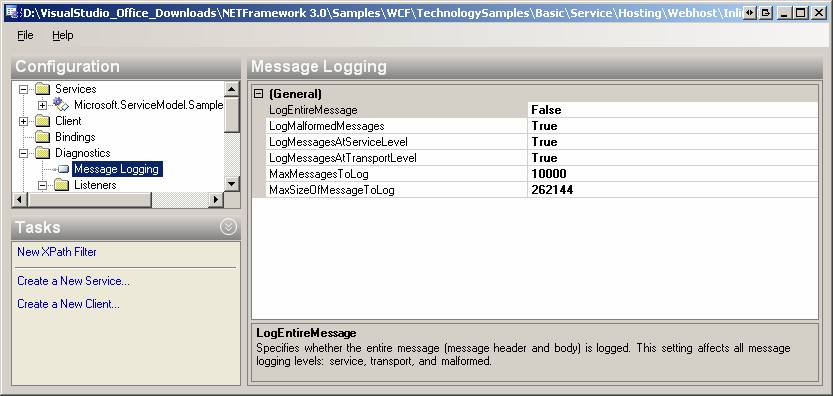
In addition to logging levels, the user can modify other options under the Message Logging leaf of Diagnostics:
Viewing Messages
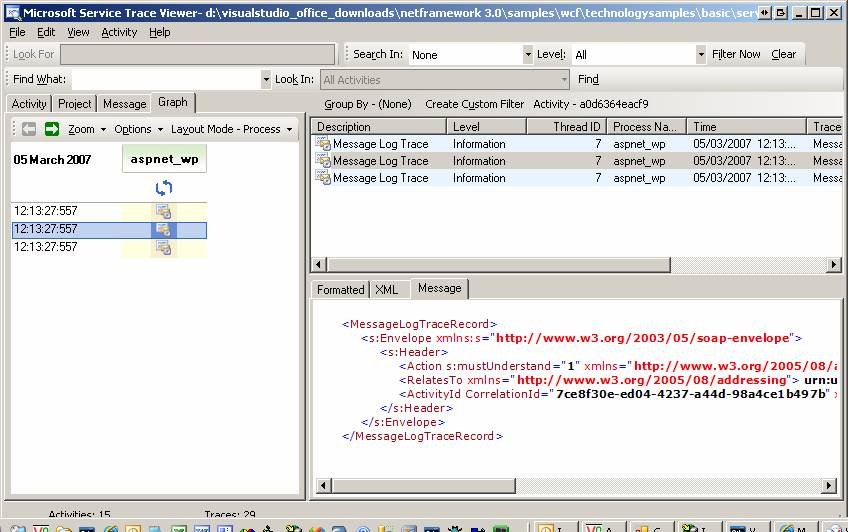
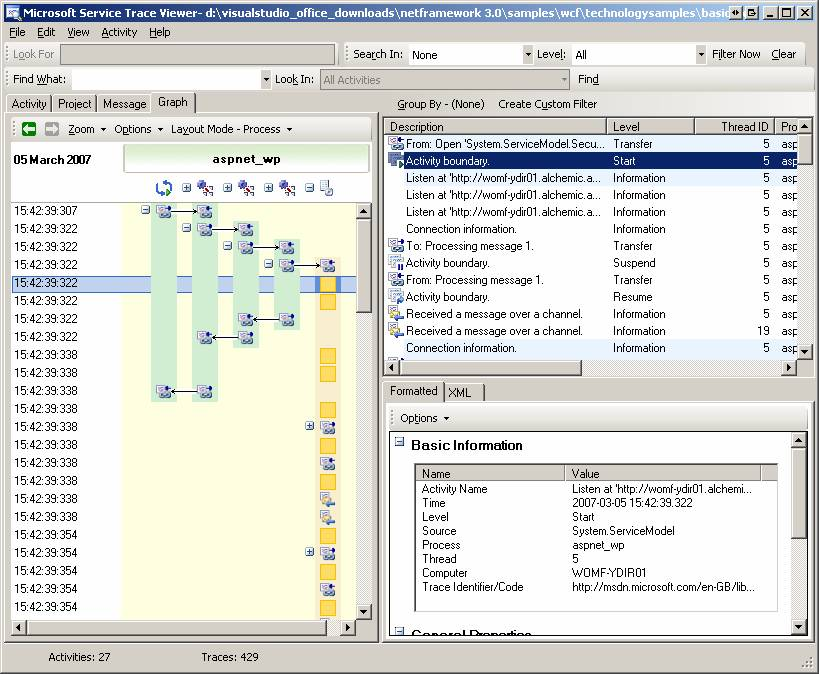
WCF messages should be viewed with the Service Trace Viewer SvcTraceViewer.exe as shown below:
Note on security: When message logging is enabled, personal information in application-specific headers, such as, a query string; and body information, such as, a credit card number, can become visible in the logs. The application deployer is responsible for enforcing access control on the configuration and log files. If you do not want this kind of information to be visible, you should disable logging, or filter out part of the data if you want to share the logs.
The following tips can help you to prevent the content of a log file from being exposed unintentionally:
- Ensure that the log files are protected by Access Control Lists (ACL) both in Web-host and self-host scenarios.
- Choose a file extension that cannot be easily served using a Web request. For example, the .xml file extension is not a safe choice. You can check the Internet Information Services (IIS) administration guide to see a list of extensions that can be served.
- Specify an absolute path for the log file location, which should be outside of the Web host vroot public directory to prevent it from being accessed by an external party using a Web browser.
Tracing
You can use tracing instead of a debugger to understand how an application is behaving, or why it faults. WCF outputs the following data for diagnostic tracing:
- Traces for process milestones across all components of the applications, such as operation calls, code exceptions, warnings and other significant processing events."
- Windows error events when the tracing feature malfunctions.
WCF tracing is built on top of System.Diagnostics. To use tracing, you should define trace sources in the configuration file or in code. WCF defines a trace source per WCF assembly. The System.ServiceModel trace source is the most general WCF trace source, and records processing milestones across the WCF communication stack, from entering/leaving transport to entering/leaving user code. The System.ServiceModel.MessageLogging trace source records all messages that flow through the system.
You can configure tracing using the application’s configuration file—either Web.config for Web-hosted applications, or Appname.exe.config for self-hosted applications. The following shows how to enable tracing and set a trace source using the SvcConfigEditor tool:
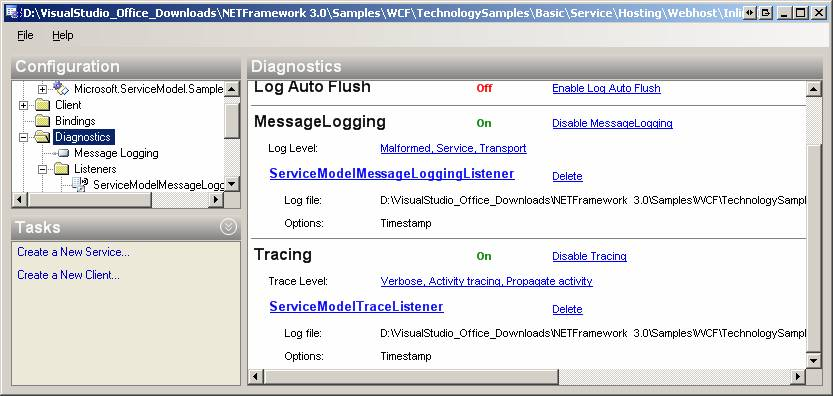
At runtime, WCF feeds trace data to the listeners which process the data. WCF provides several predefined listeners for System.Diagnostics, which differ in the format they use for output. You can also add custom listener types.
End-To-End Tracing
End-To-End tracing can be observed with the Service Trace Viewer SvcTraceViewer.exe utility:
This utility is initially difficult to understand. To help you get started:
-
Understand the meaning
of Activity and Transfer:
An activity is a logical unit of processing that groups all traces related to that processing unit. To emit activity traces at run time, use the ActivityTracing setting for the System.ServiceModel trace source:
<source name="System.ServiceModel" switchValue="Verbose,ActivityTracing"
Two activities are related with Transfer when control flows between these activities, e.g., a method call crossing activity boundaries. A trace transfer indicates how different activities are related to each other. You can see that a particular activity caused another to start. For example, a message request started a security handshake to get a Secure Conversation Token
-
Refer to article Service Trace Viewer Tool (SvcTraceViewer.exe) for an overview of the utility and what the different icons mean.
- Refer to article Using Service Trace Viewer for Viewing Correlated Traces and Troubleshooting for help on how to use this utility.